Bank Statements
The Bank Statements section allows Admins to upload, view, categorize, and manage all company bank transactions in one place. This feature helps maintain financial accuracy, streamline bookkeeping, and prepare clean statements for P&L, Balance Sheet, and Cash Flow reports.
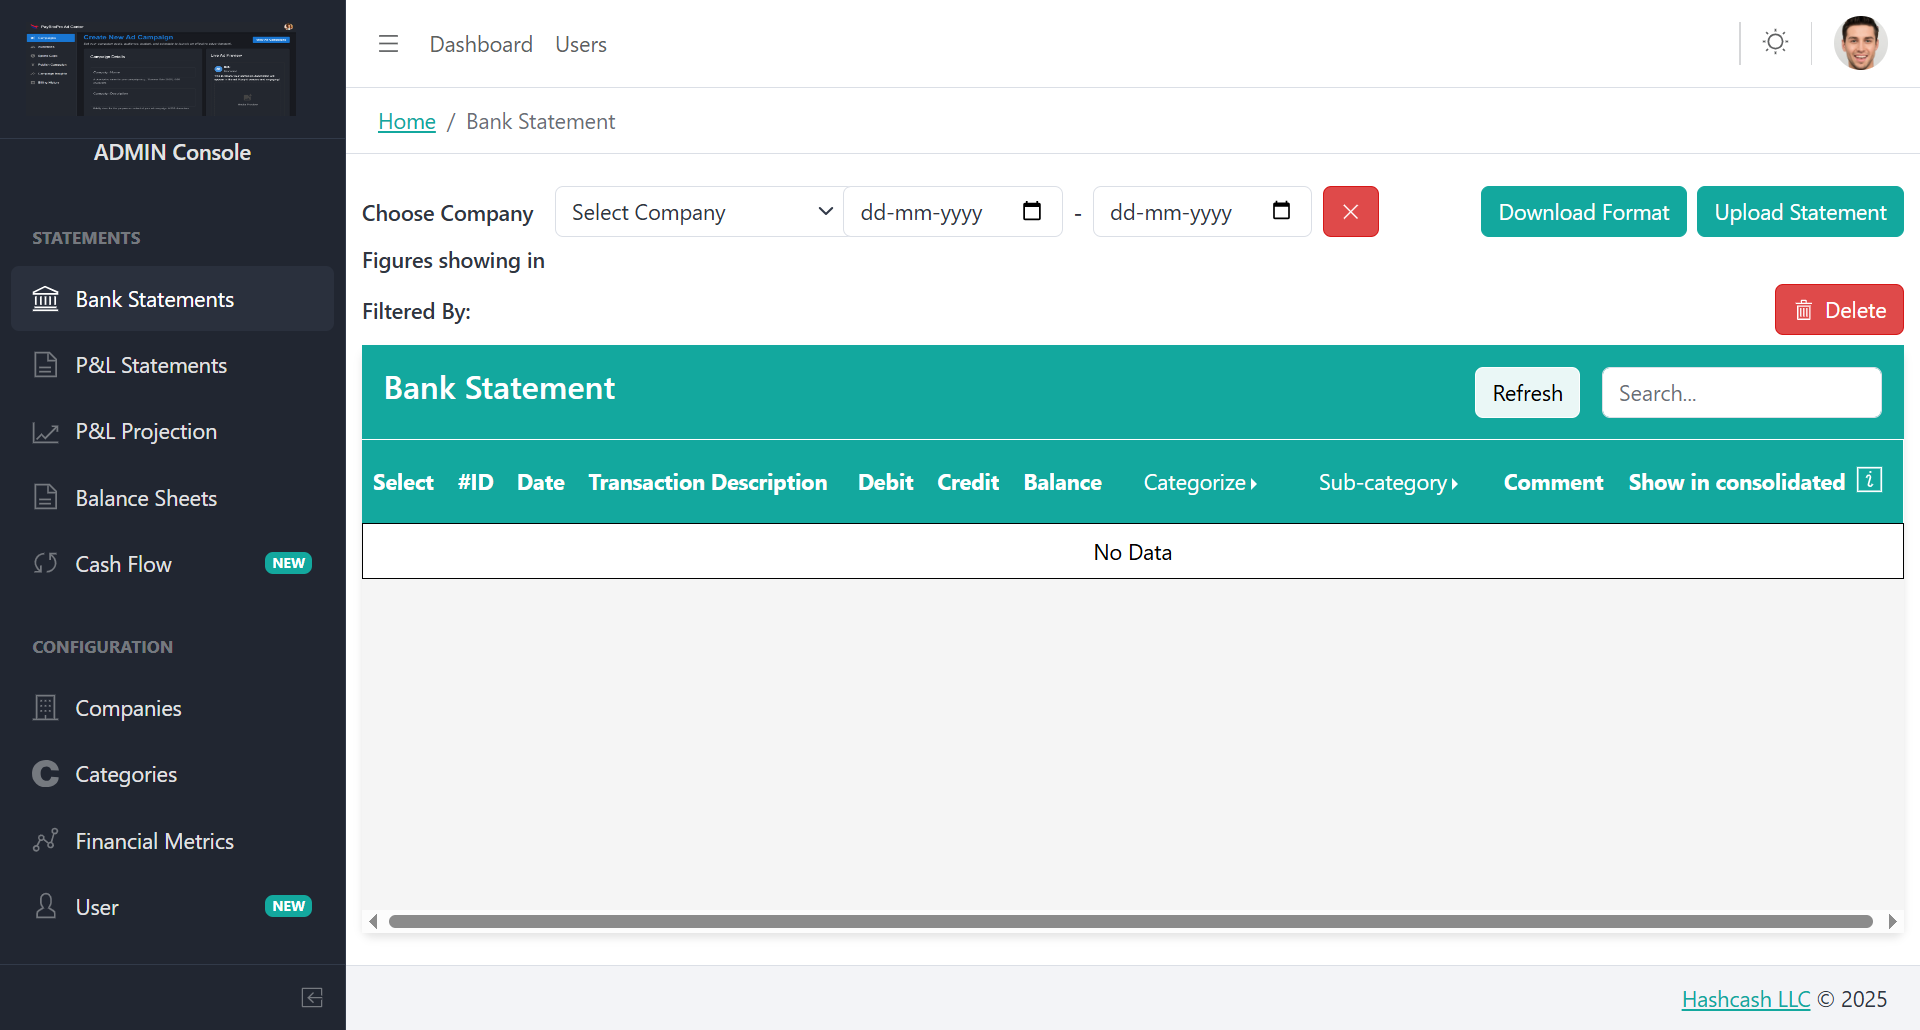
What You Can Do in This Section
1. Choose Company
Use the Select Company dropdown to pick the company whose bank transactions you want to view or manage.
2. Select Date Range
Choose the date range using the From and To date filters. Click Reset (X) to clear the filters.
3. Download Format
Click Download Format to download the predefined Excel/CSV format required for uploading bank statements.
4. Upload Statement
Upload your bank statement file by clicking Upload Statement. Make sure the file matches the required format.
5. Filter & Search
Use the Filtered By panel to apply filters. Use the Search box to find specific transactions.
6. Refresh Data
Click Refresh to reload and display the latest bank statement entries.
Bank Statement Table Overview
| Column | Description |
|---|---|
| Select | Choose entries for delete or categorization |
| ID | Unique transaction ID |
| Date | Transaction date |
| Transaction Description | Description from bank statement |
| Debit | Outgoing transaction amount |
| Credit | Incoming transaction amount |
| Balance | Running balance after transaction |
| Categorize | Assign category for bookkeeping |
| Sub-category | Add specific classification |
| Comment | Add notes for reference |
| Show in consolidated | Toggle for consolidated reports |
Frequently Asked Questions
This may happen if the uploaded file does not match the required format. Download the template, fill it correctly, and upload again. Also ensure you selected the correct Company and Date Range.
BitoBooks supports Excel (.xlsx) or CSV files based on the system's required template. Always use the Download Format file to avoid formatting issues.
You cannot edit the debit/credit amount or date, but you can update Categorization, Sub-category, Comments, and Consolidated view toggle. For data errors, re-upload the corrected statement.
This toggle allows you to include or exclude a transaction from consolidated financial reports. Turn it ON to include, or OFF to exclude.
P&L Statements
The P&L Statements section in BitoBooks helps you generate a Profit & Loss report for any company and financial period. This report summarizes revenues, expenses, and net profit, allowing you to understand business performance at a glance.
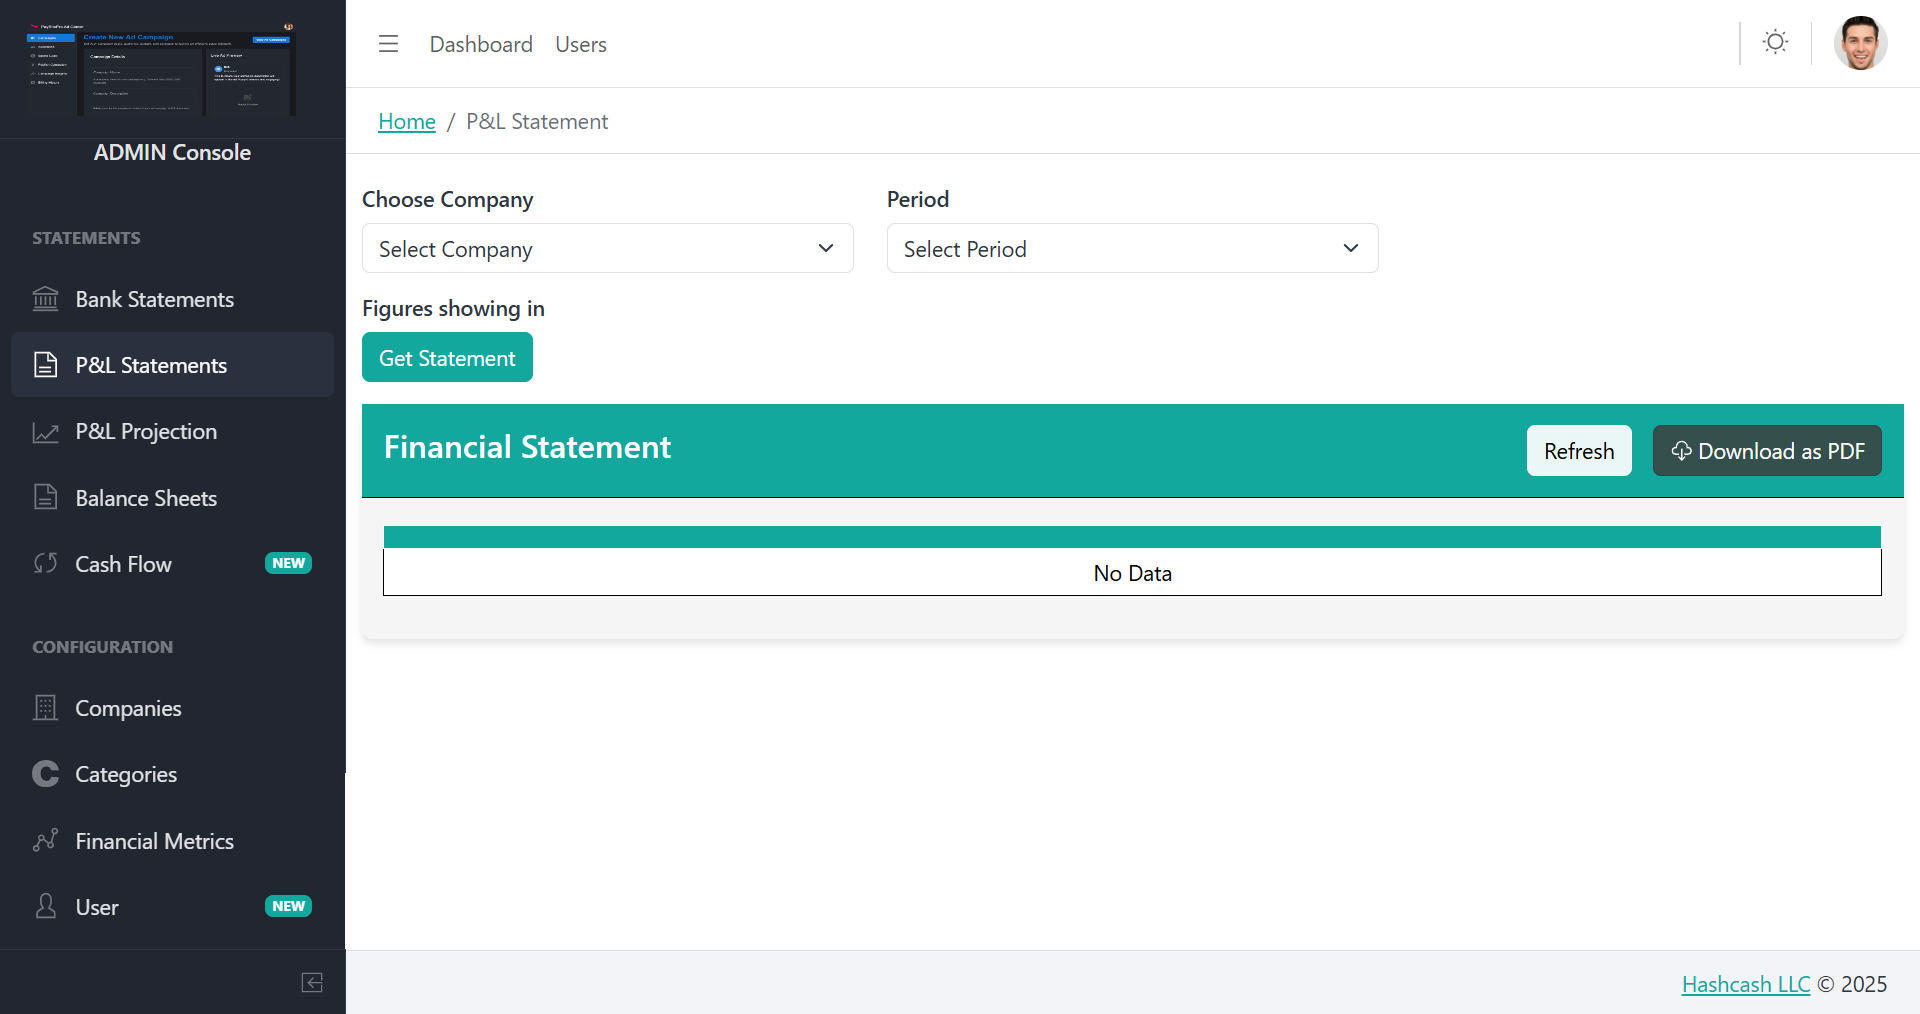
What You Can Do in This Section
Choose Company
Use the Select Company dropdown to choose the company for which you want to generate a P&L statement.
Select Period
Choose the reporting period: Monthly, Quarterly, Half-yearly, Yearly, or Custom periods.
Generate the Statement
Click Get Statement to generate the Profit & Loss Statement based on uploaded and categorized transaction data.
View & Download
View the detailed Financial Statement showing income categories, expense categories, total income, total expenses, and net profit. Click Download as PDF to export.
Frequently Asked Questions
This happens when no categorized transactions match the selected Company and Period. Ensure bank statements are uploaded, all transactions are categorized, and the correct reporting period is selected.
Yes, but you must click Refresh or regenerate the statement using Get Statement to see the updated numbers.
P&L Projection
The P&L Projection section helps you forecast future profits and expenses based on historical financial data. It uses smart projection methodologies to estimate upcoming revenue and cost trends.
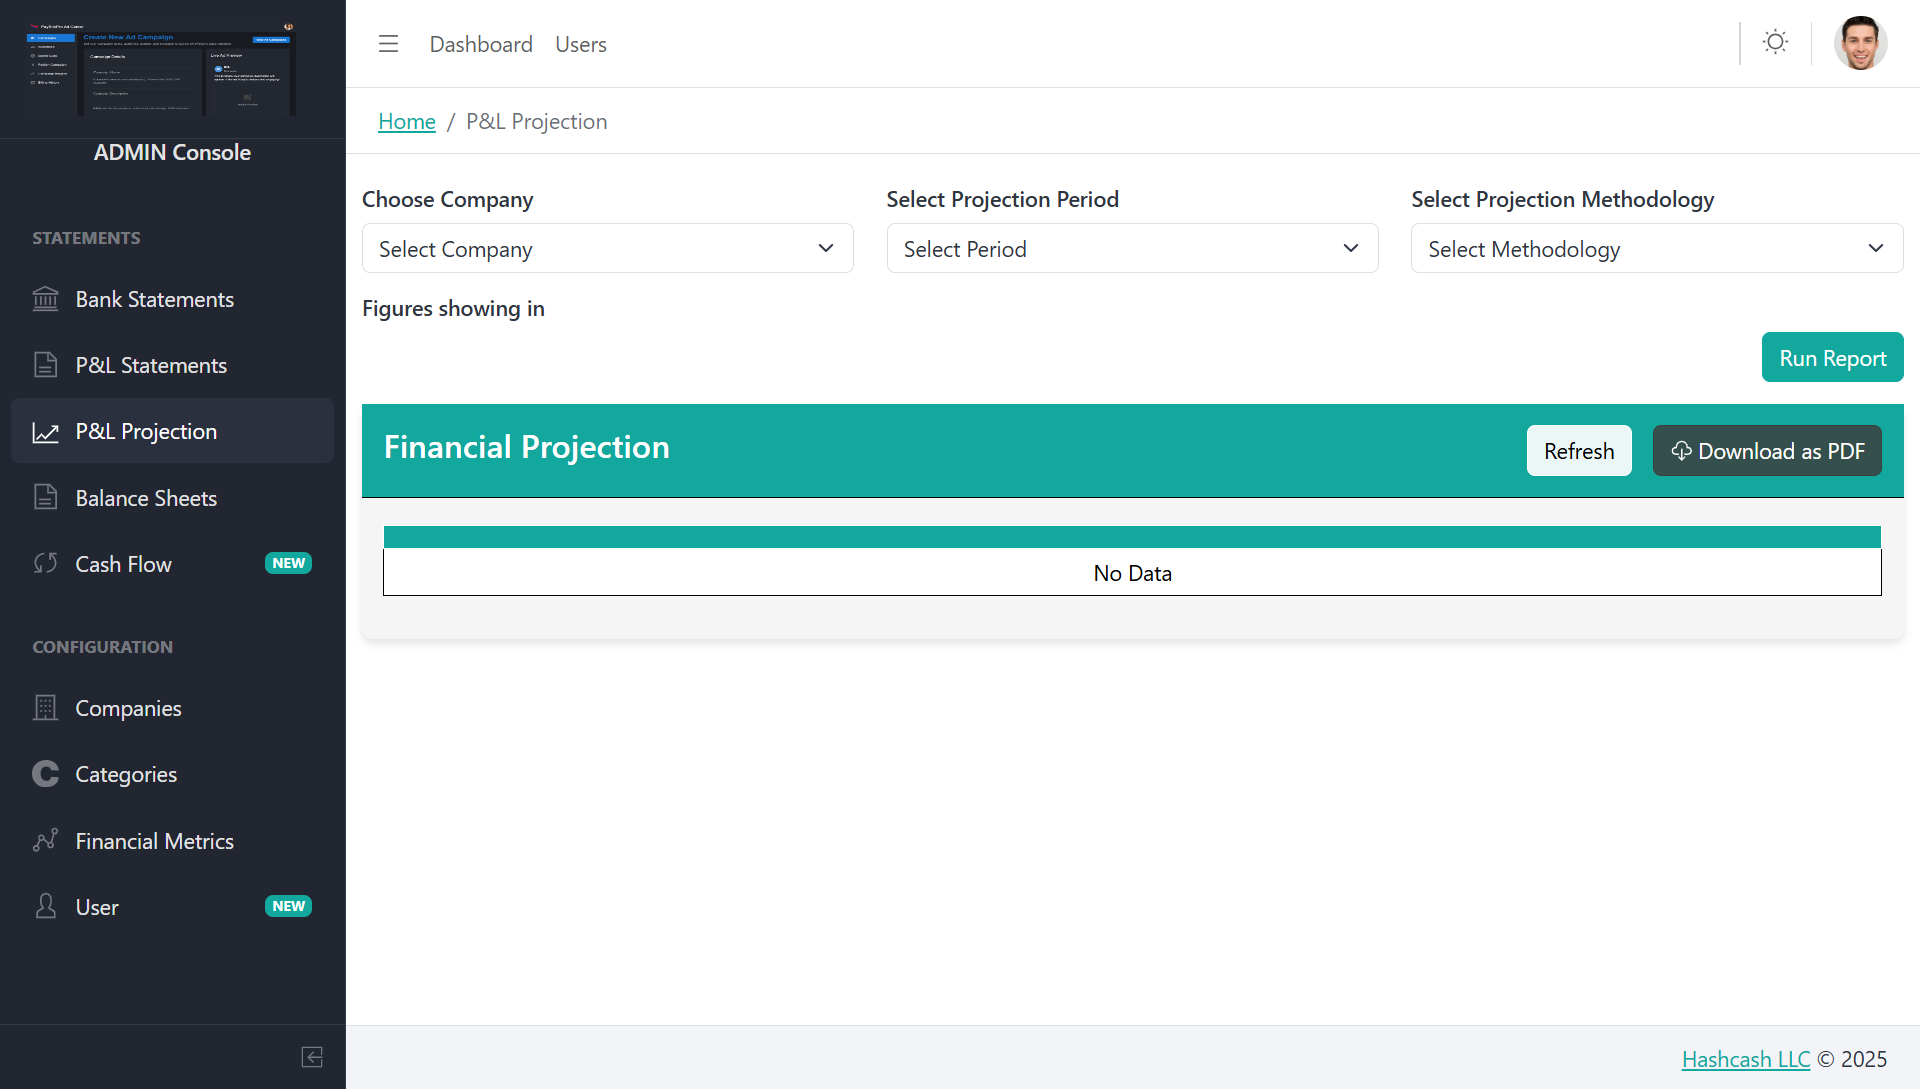
Available Projection Methodologies
Last 1 Month
Recent Trends
Last 3 Months
Short-term Avg
Last 6 Months
Stable Forecast
Last 12 Months
Long-term Avg
Last 3 Complete Months Growth Rate Average
Calculates the average growth rate of the last 3 complete months and uses it to predict future values. Good balance for short-term trend forecasting.
Last 6 Complete Months Growth Rate Average
Takes the average growth rate from the last 6 complete months to create a more stable and longer-term projection. Helps smooth out fluctuations.
Last 12 Complete Months Growth Rate Average
Uses the average growth rate of the last 12 complete months, offering the most balanced, year-long trend-based forecast. Most reliable for long-term planning.
Frequently Asked Questions
Last 1 month: Best for fast-changing or seasonal businesses
Last 3 months: Good balance for short-term trend forecasting
Last 6 months: Helps smooth out fluctuations
Last 12 months: Most reliable long-term average
Projections are estimates based on historical growth trends. Accuracy depends on consistency of past data, seasonal variations, and selected methodology. Use longer historical windows (6 or 12 months) for more precise planning.
Balance Sheets
The Balance Sheets section allows you to view, create, and manage the financial position of a company for a selected financial year. This module summarizes your Assets, Liabilities, and Equity.
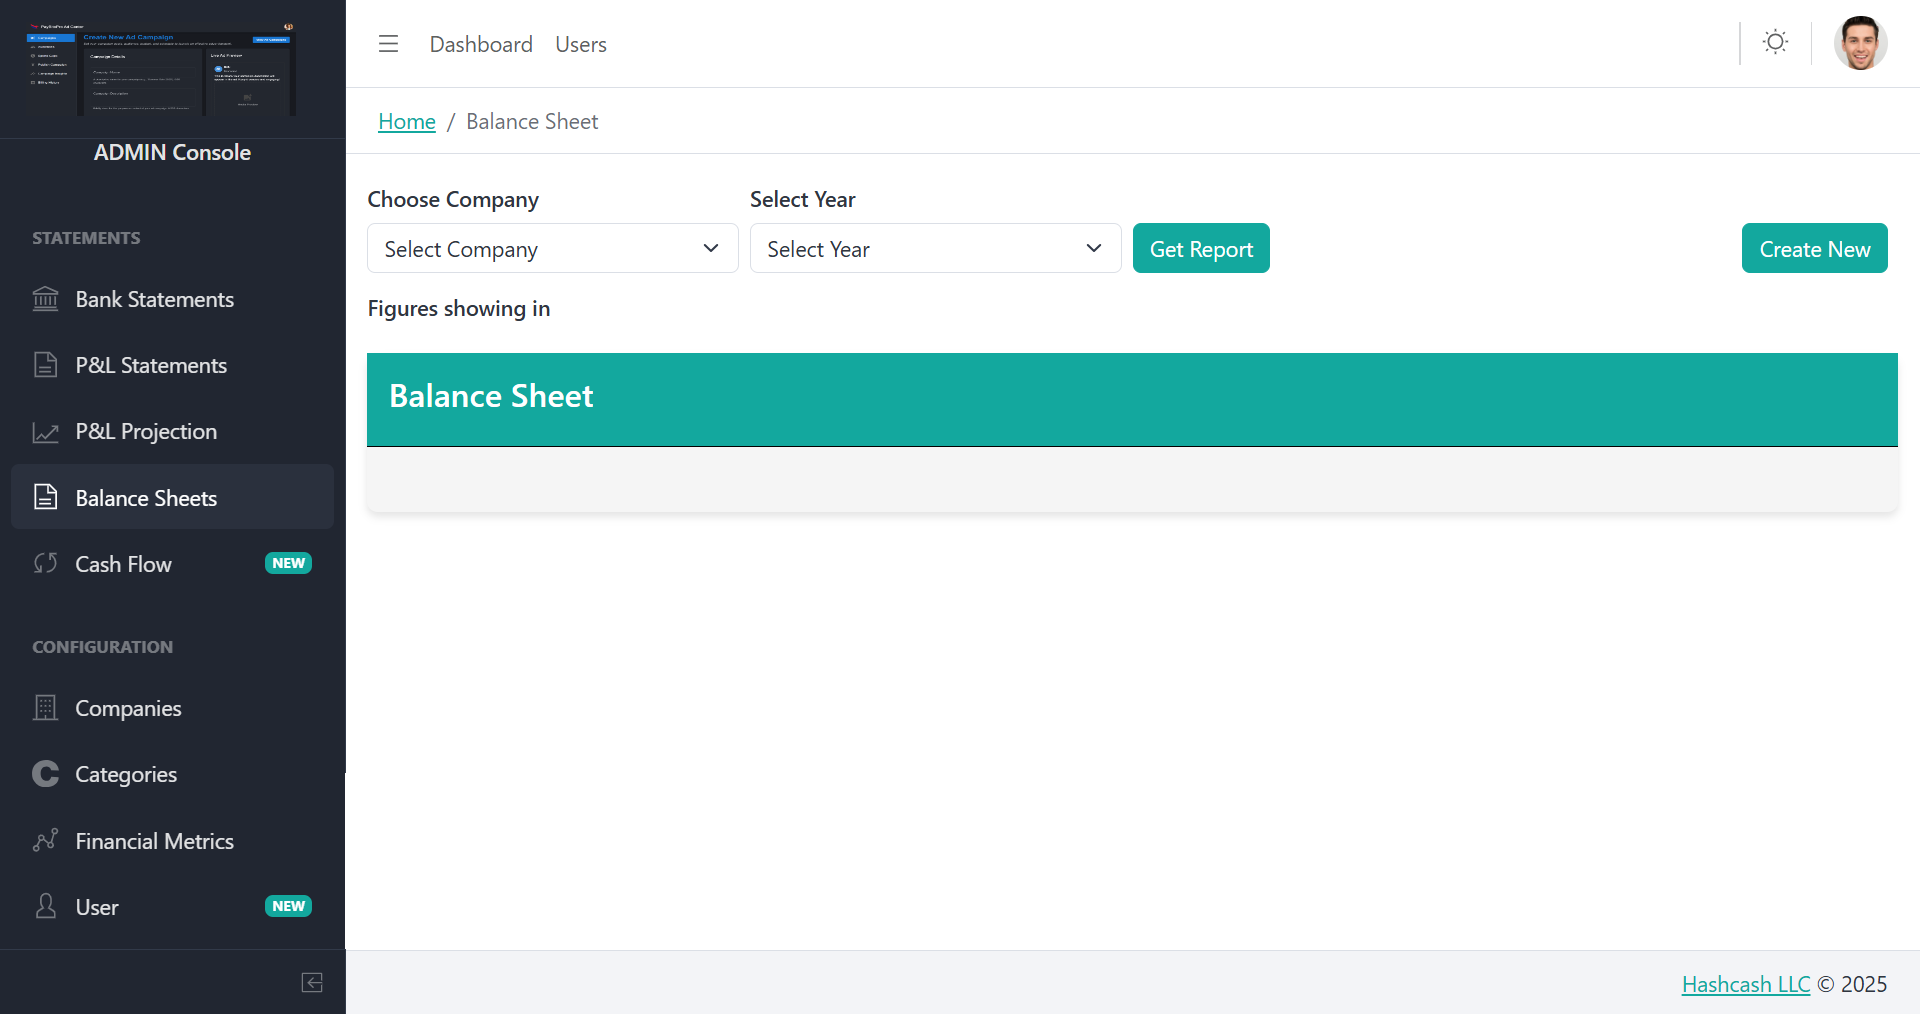
How to Use the Balance Sheets Section
Choose Company
Select the company for which you want to view or create the balance sheet.
Select Year
Choose the financial year for which you want to generate the report.
Get Report or Create New
Click Get Report to fetch existing balance sheet, or Create New to open the Balance Sheet Form.
Balance Sheet Form Notes
The form contains various sections representing specific components:
Share Capital
Enter Authorised and Issued share capital details including number of equity shares and face value.
Surplus
Retained earnings (Profit After Tax). Includes opening balance, additions, and closing balance.
Trade Payables
Amounts payable to vendors/suppliers and dues to micro and small enterprises.
Other Current Liabilities
Payable for expenses, advance from customers, statutory liabilities.
Tangible Assets
Fixed assets with W.D.V, additions, sales, depreciation rate, and depreciation values.
Intangible Assets
Software, patents, and other intangible items with similar fields as tangible assets.
Trade Receivables
Receivables from customers and total outstanding amounts.
Cash and Bank Balances
Cash in hand and balances with banks (current accounts).
Frequently Asked Questions
Yes. Most totals such as asset totals, liabilities, and depreciation calculations are auto-generated based on the values entered.
Go to #7 Tangible Assets or #8 Intangible Assets and click Add Asset to enter new asset details.
Cash Flow
The Cash Flow section allows you to generate and review the cash flow statement for any company configured in the system. This report provides a clear view of cash inflows and outflows for the selected financial year.
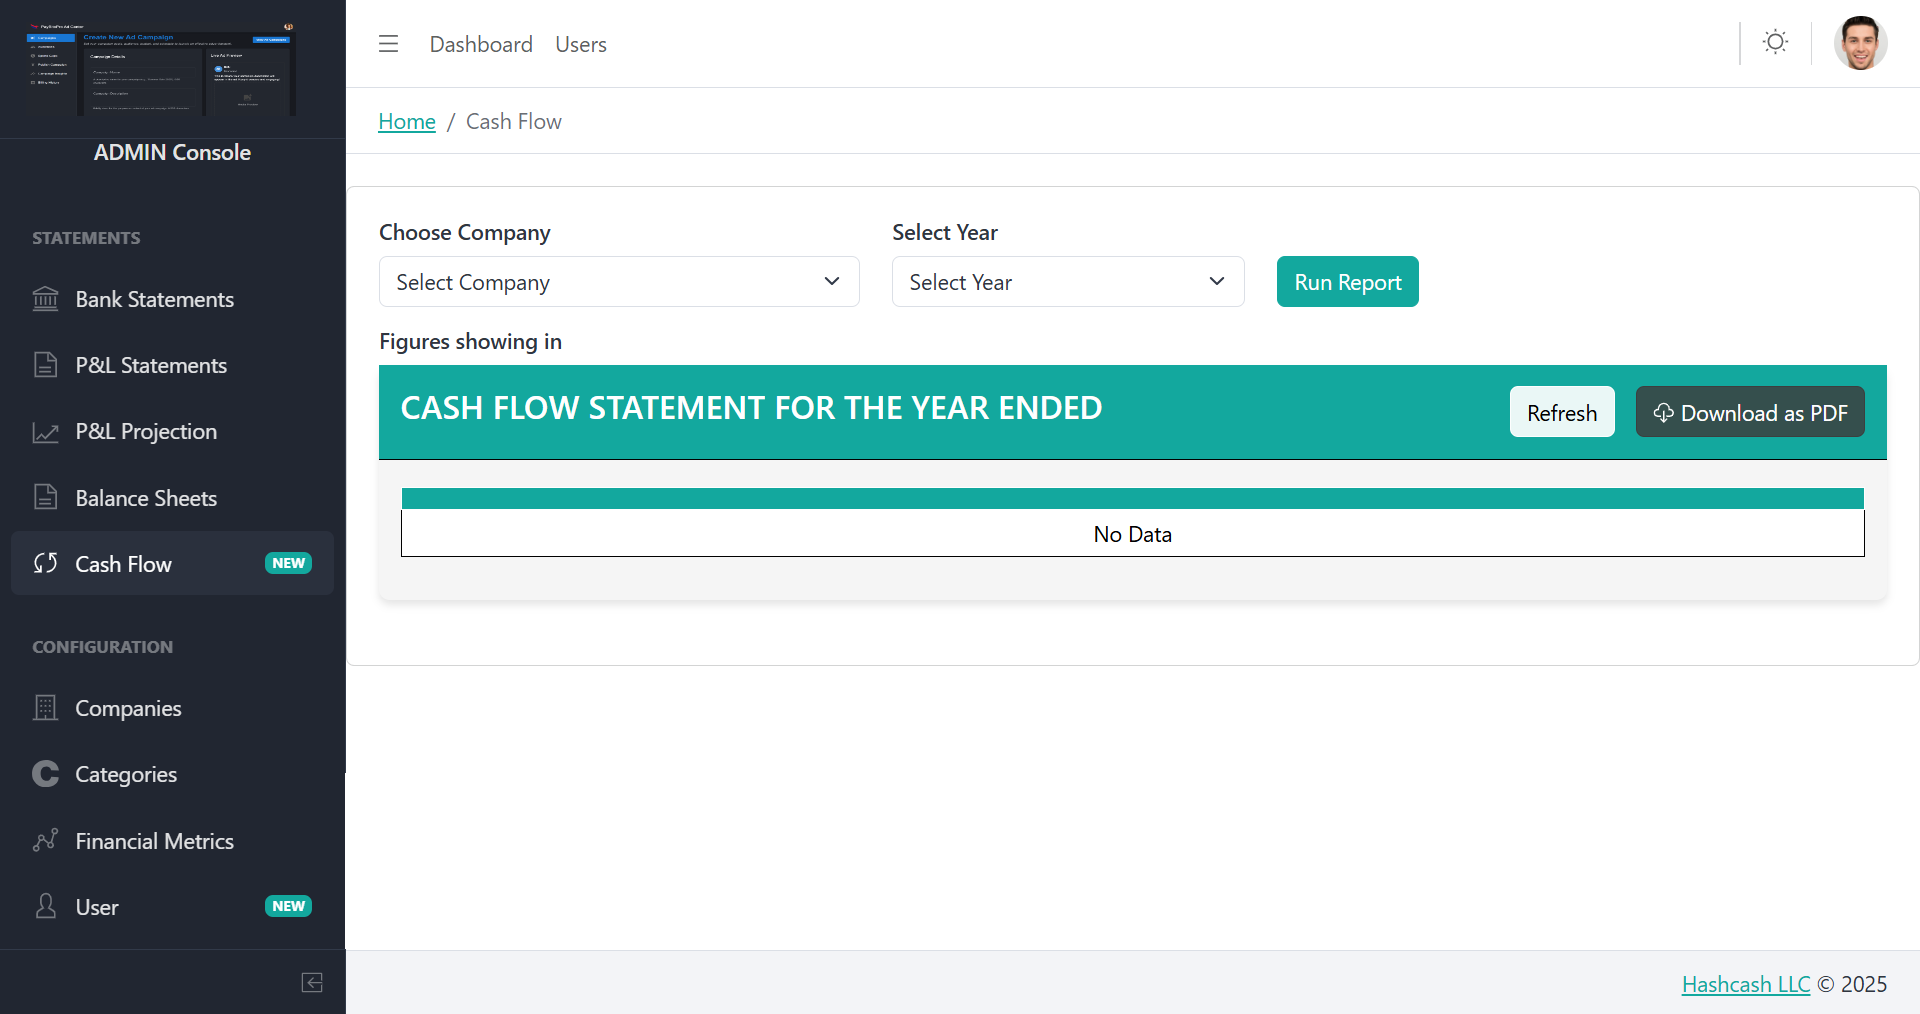
How to View the Cash Flow Statement
Go to Cash Flow
From the left-side menu under Statements, click on Cash Flow.
Choose Company
Click the Select Company dropdown and choose the company for which you want to view the report.
Select Year
Use the Select Year dropdown to choose the financial year.
Run Report
Click Run Report to generate the cash flow statement with detailed breakdown of cash inflows and outflows.
Available Actions
Refresh
Reload the data or update the report after changes in company records.
Download as PDF
Export and save the generated cash flow statement as a PDF file.
Frequently Asked Questions
No. The system currently allows you to generate the cash flow statement for one selected year at a time. You can rerun the report using different year selections as needed.
Companies
The Companies section allows the Admin to manage all company profiles configured within the system. From here, you can add new companies, edit existing details, change status, and review key information.
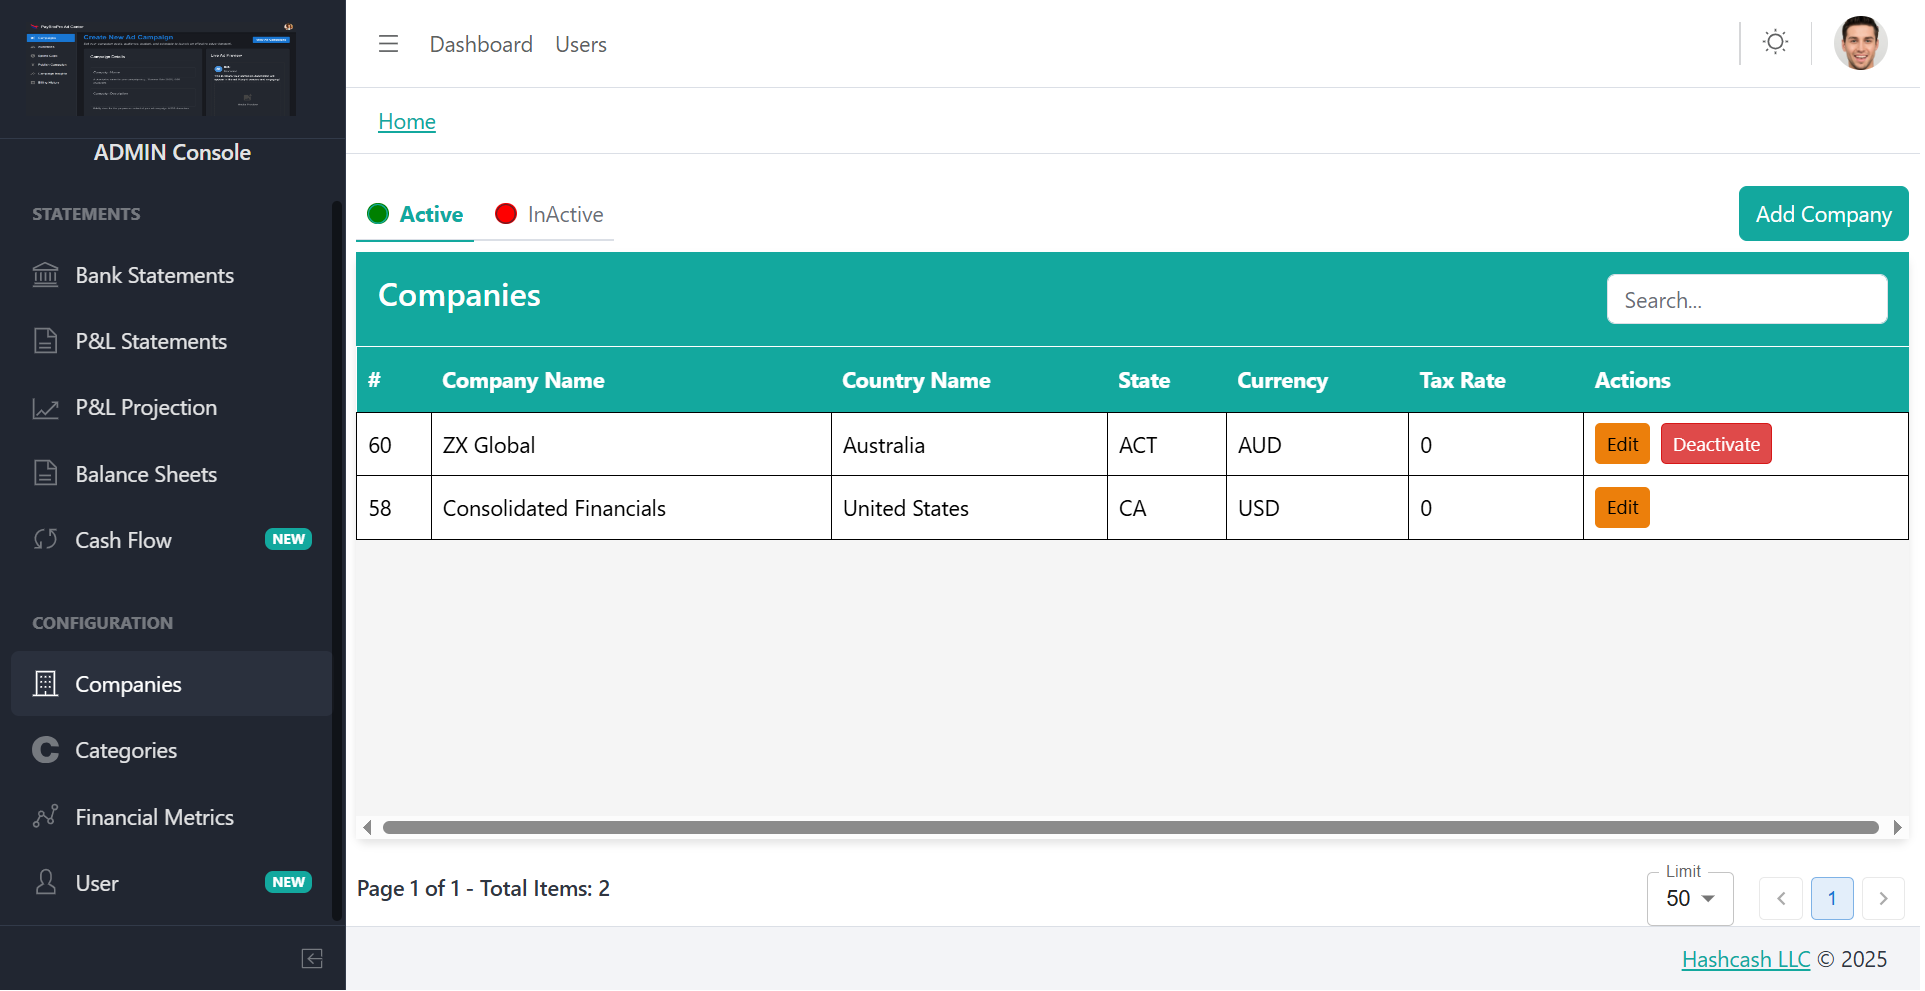
Companies Overview
| Column | Description |
|---|---|
| ID (#) | Unique company identifier |
| Company Name | Name of the company |
| Country Name | Country of registration |
| State | State/Province |
| Currency | Operating currency |
| Tax Rate | Applicable tax rate |
| Actions | Edit or change status |
Add a New Company
Click Add Company
Click the Add Company button located at the top-right corner.
Enter Required Details
Fill in Company Name, Country, State, Currency, and Tax Rate.
Click Create
The new company will now appear in the list.
Categories
The Categories section allows the Admin to manage the financial categories used throughout the system, including Revenue, Expenses, R&D, Sales & Marketing, and more.
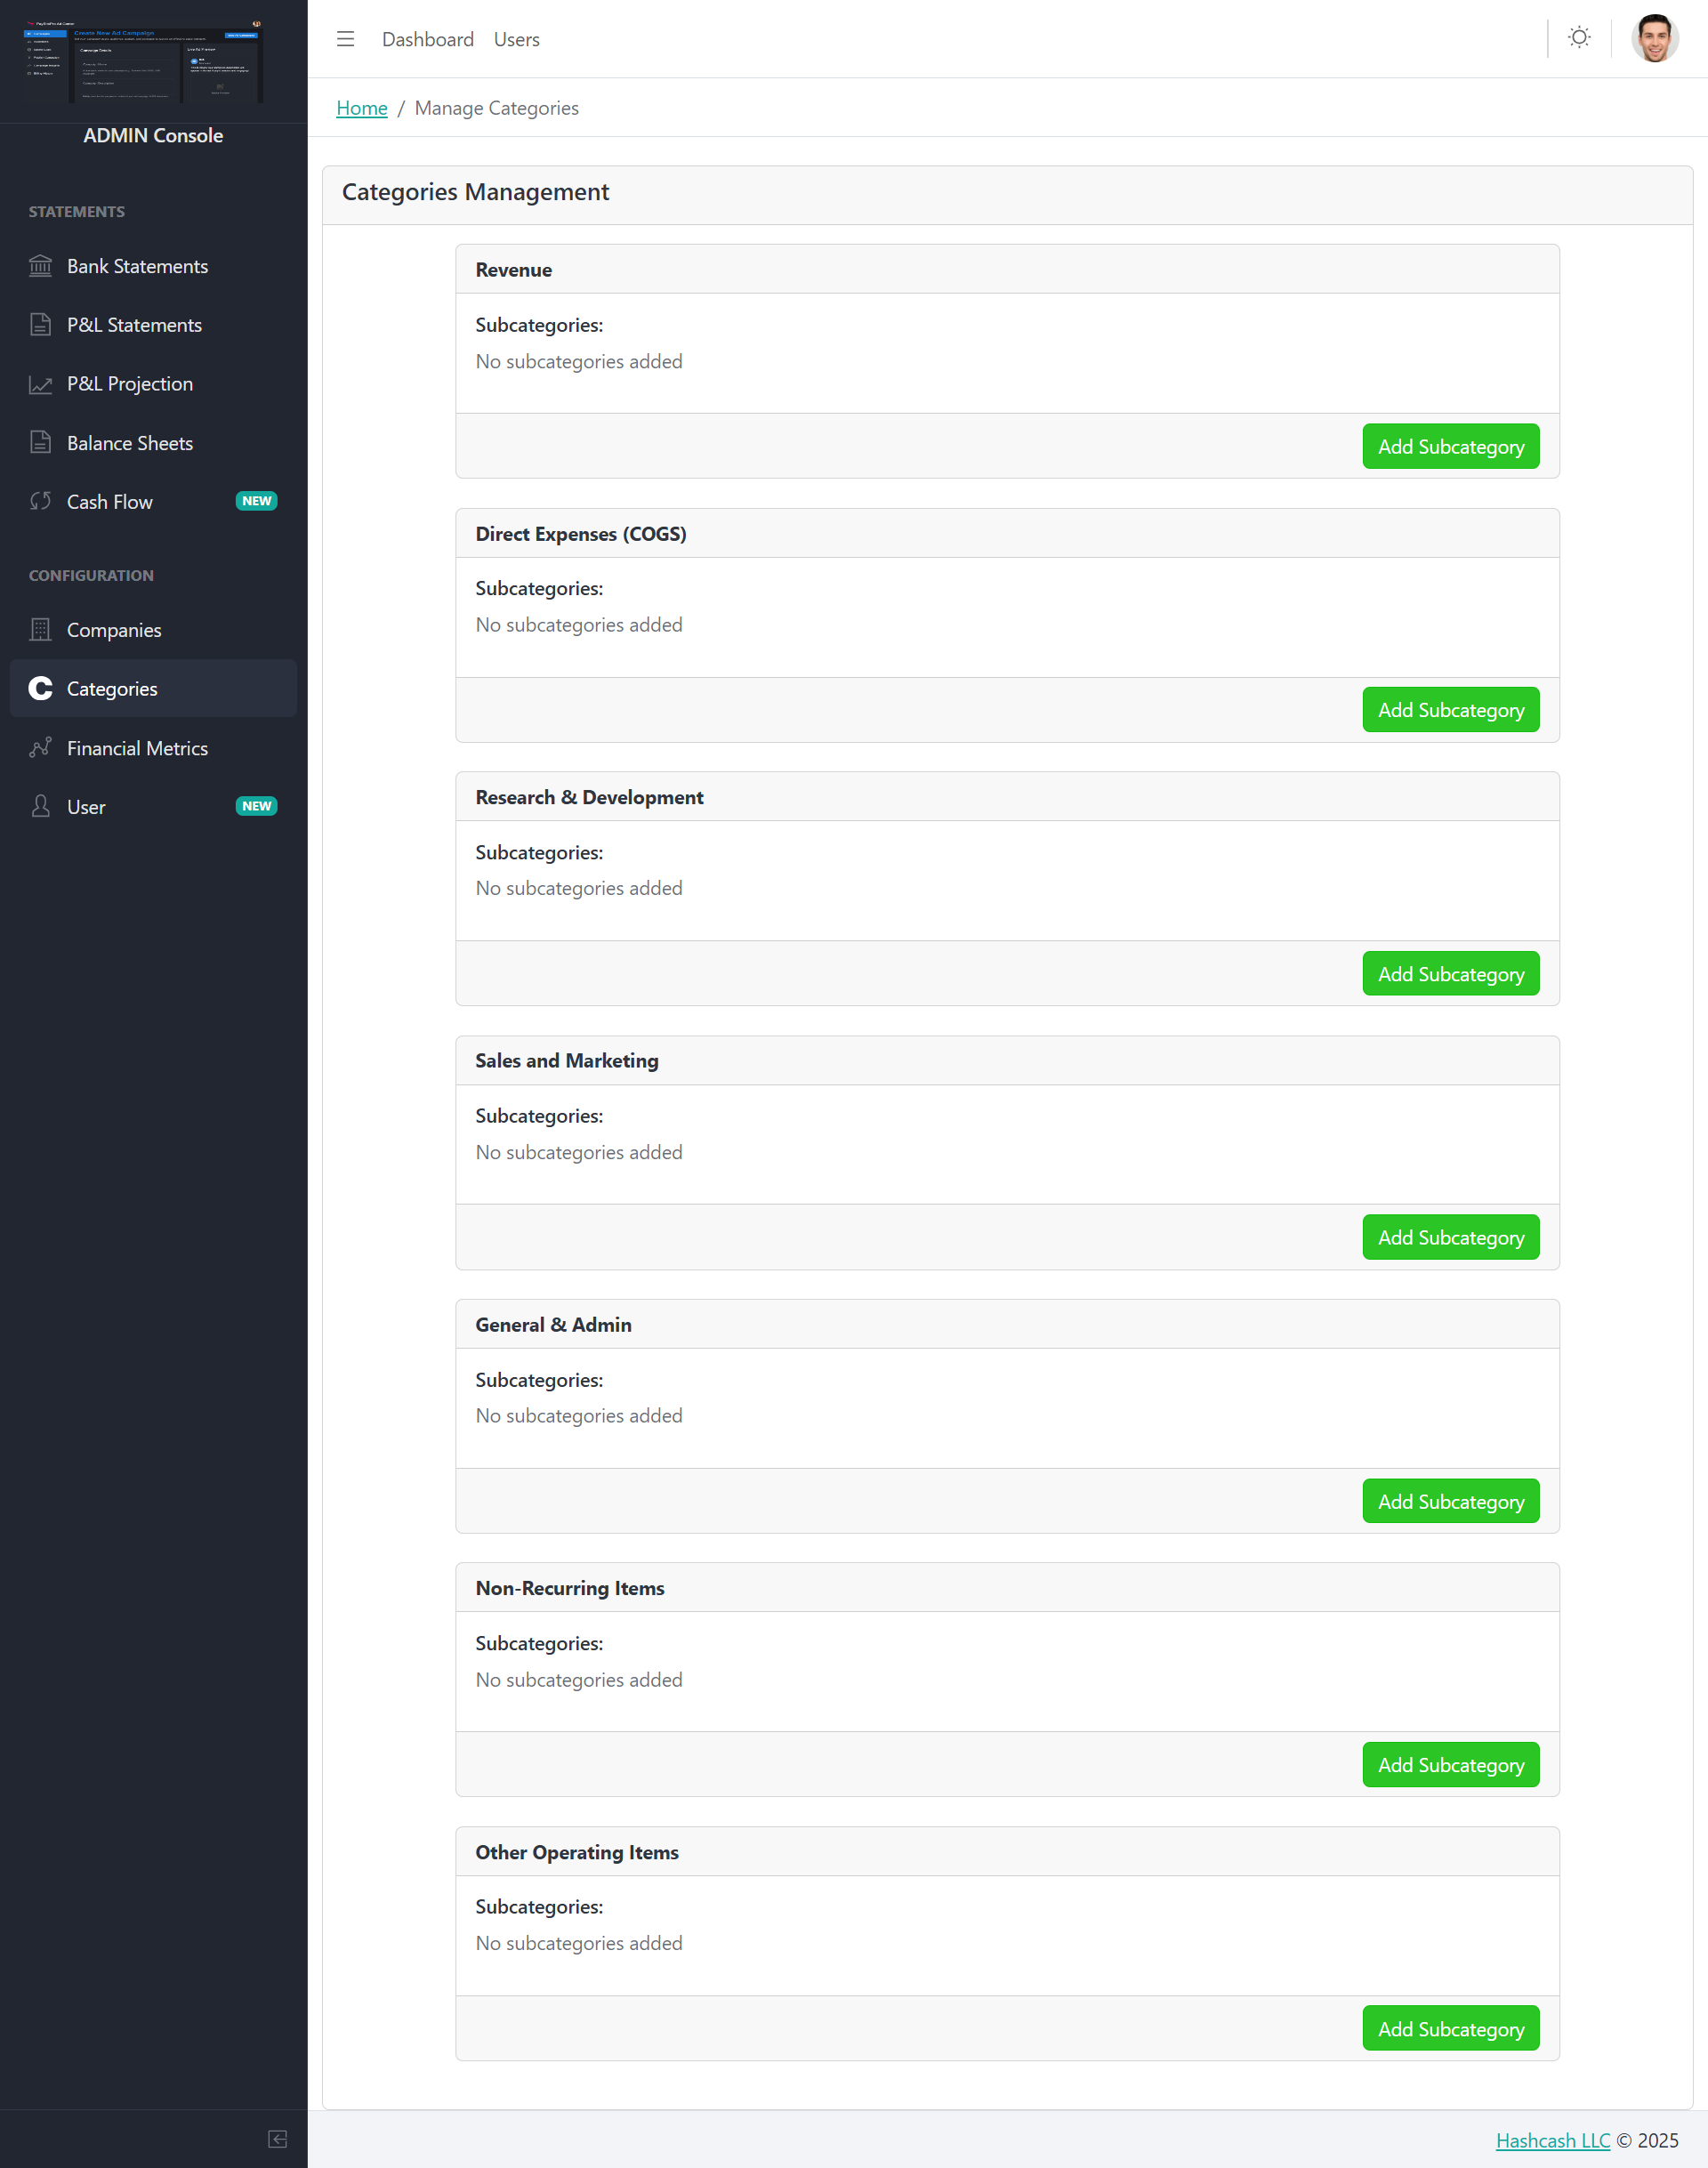
Predefined Main Categories
Revenue
Income
Direct Expenses
COGS
Research
R&D
Sales & Marketing
Promotion
General & Admin
Operations
Non-Recurring
Special Items
Add a Subcategory
Steps to Add Subcategory
1. Locate the category where you want to add a subcategory
2. Click the Add Subcategory button on the right side
3. Enter the subcategory title (e.g., "Subscription Revenue", "Server Costs")
4. Click Save to add it under the selected category
Frequently Asked Questions
Main categories are predefined financial groups aligned with standard accounting structures. Admins can only add subcategories within these groups.
Yes. Subcategories are used to classify transactions and entries, which reflect directly in P&L statements, Cash Flow analysis, and other financial reports.
Financial Metrics
The Financial Metrics section allows the Admin to input monthly business performance data. These metrics help generate accurate financial reports, forecasts, and customer health insights.
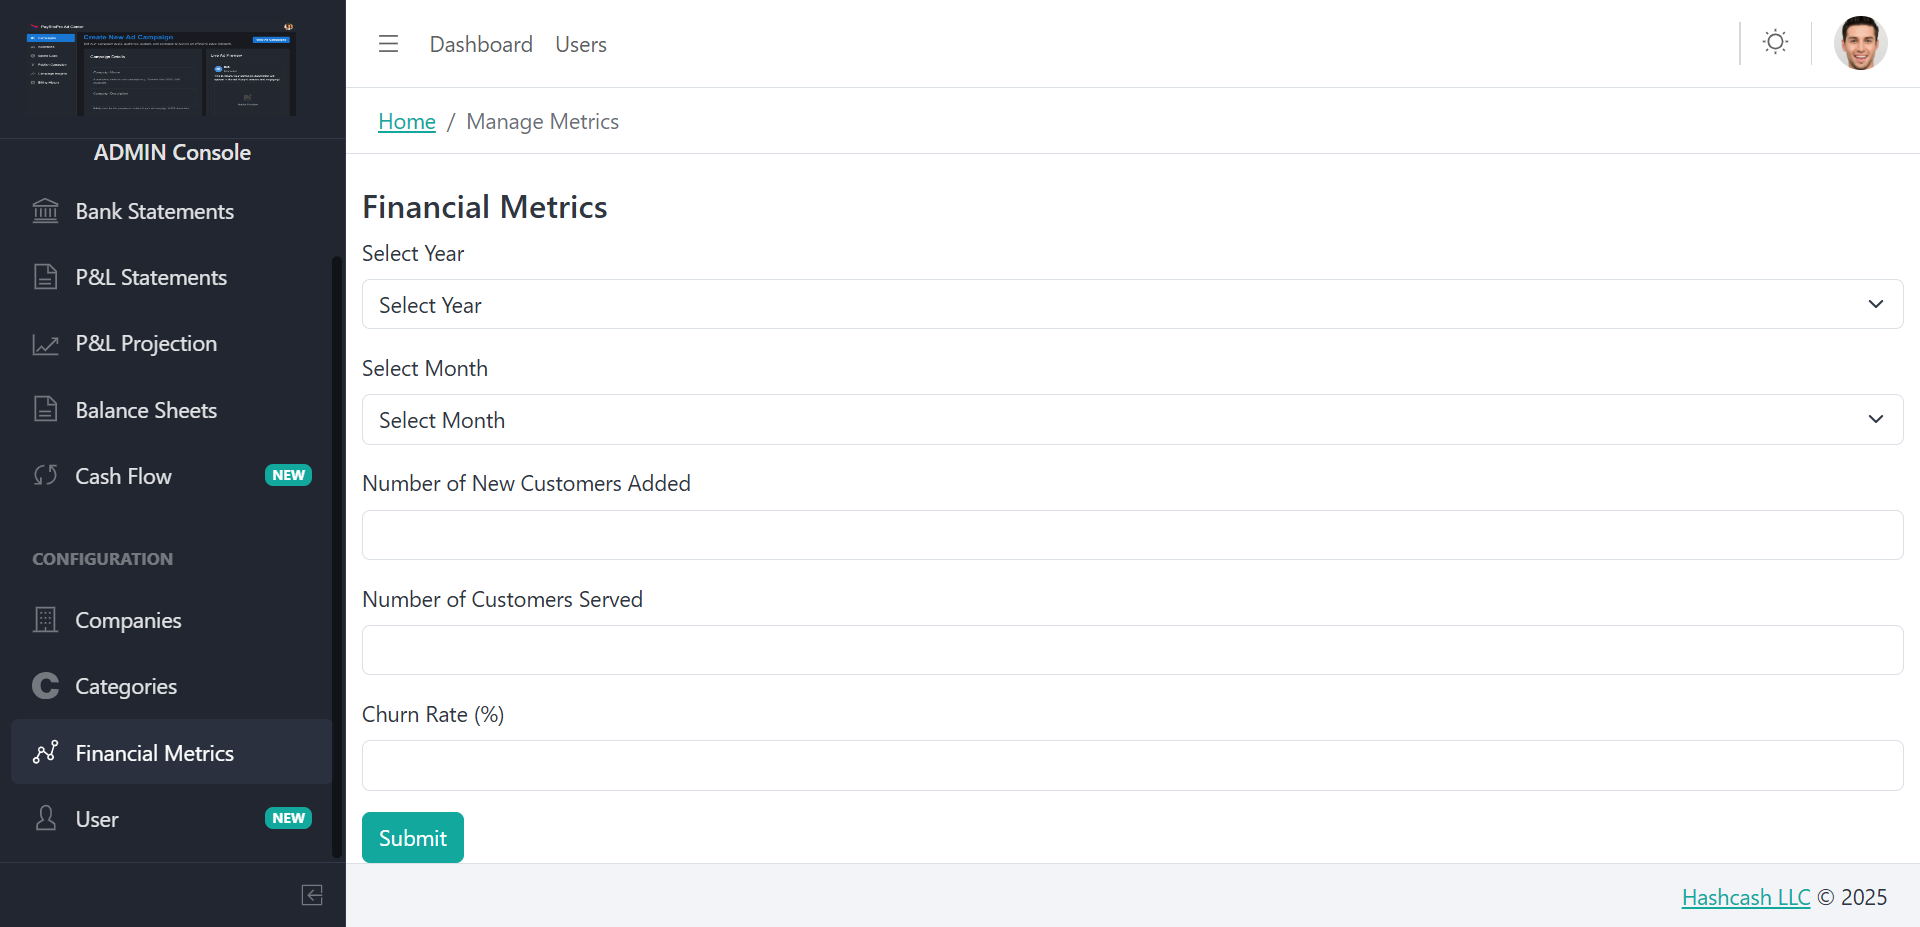
Metric Input Fields
1. Select Year
Choose the year for which you want to record financial metrics. The system organizes all metric entries by year for easier reporting and comparison.
2. Select Month
Choose the month corresponding to the data you want to enter. Each month can have its own set of metrics for detailed month-over-month tracking.
3. Number of New Customers Added
Enter the total number of new customers acquired during the selected month. This helps calculate growth rate, acquisition trends, and monthly recurring user increases.
4. Number of Customers Served
Enter the total number of active customers served during the month. Essential for understanding service coverage, usage patterns, and active customer base size.
5. Churn Rate (%)
Input the churn rate percentage for the month. This represents the percentage of customers who discontinued service, crucial for retention analysis and revenue stability prediction.
Frequently Asked Questions
Monthly metrics help the system generate accurate financial reports, analyze customer trends, and calculate business performance indicators such as growth and churn.
Churn rate helps measure customer retention. It's used in forecasting, revenue projections, customer lifetime value calculations, and overall business health analysis.
Users
The User section allows the Admin to manage all users who have access to the system. From here, you can view user details, add new users, update their access level, and manage their account status.
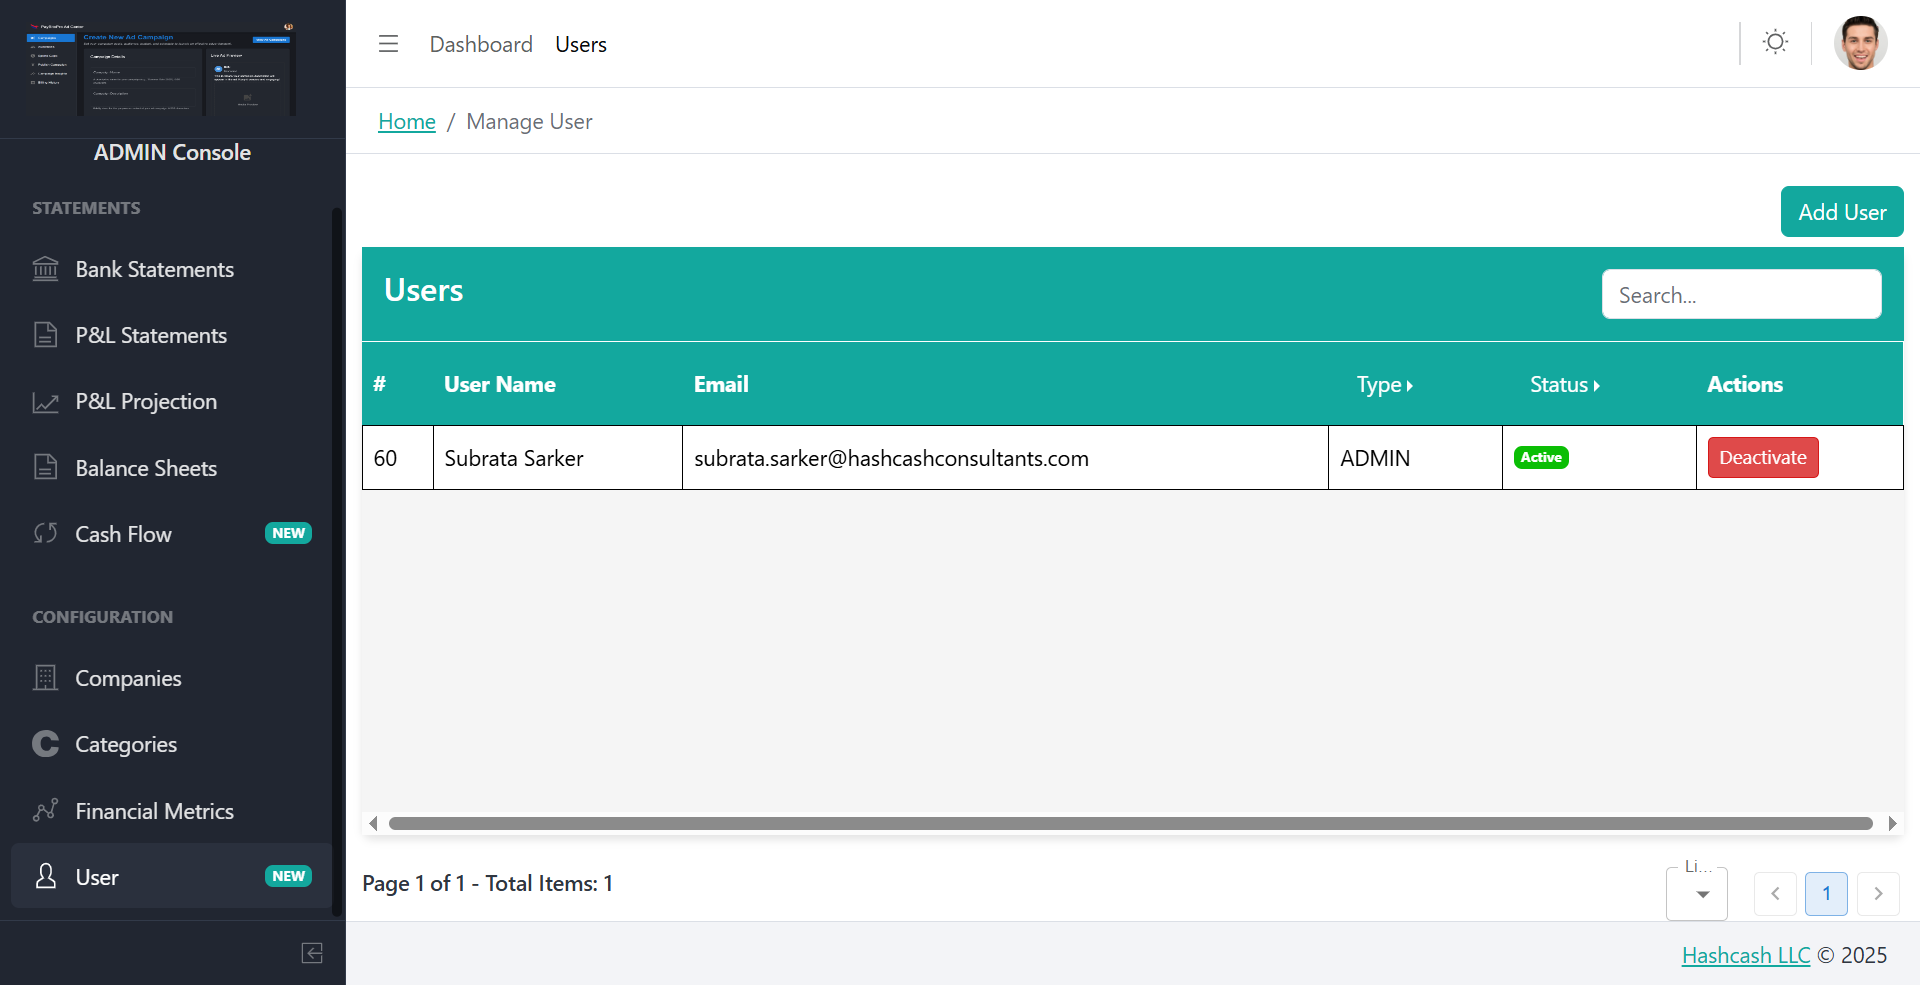
Users Overview
| Column | Description |
|---|---|
| ID (#) | Unique identifier |
| User Name | First and last name |
| Registered email address | |
| Type | User role (Admin or User) |
| Status | Active or Inactive |
| Actions | Deactivate or update status |
Add a New User
Click Add User
Click the Add User button on the top-right corner of the page.
Fill Required Fields
Enter First Name, Last Name, Email Address, and User Type (Admin or User).
Submit
Click Submit to add the user. The newly added user will appear in the list.
User Roles
Admin
Has full access to manage settings, configurations, and all system functionalities.
User
Has limited access, typically restricted to operational tasks only.
Frequently Asked Questions
Active Users are those who have recently engaged with the platform within the defined time period (daily, weekly, or monthly).
Inactive user numbers may rise if users stop engaging with the platform or do not log in within the selected time frame.