Market analysis for better investment and crypto wealth
- September 26, 2022
- Jennifer Moore

The study of finance and wealth management requires a mixture of sound fundamental basics, market research, and last but not least, analytical skills. Market experts suggest experiential learning also works wonders. It is necessary for developing the necessary foresight. Crypto market analysis requires building up accurate forecasts, for which a firm understanding of the current scenario and a long-term vision is needed.
As an investor, it is necessary to conduct analysis and market research on your own for gaining an understanding of the capital and crypto markets and leverage the best possible growth opportunities from the available information. The process is time-consuming, but it is what separates professionals from amateurs.
Also Read: Avoid These 10 Financial Mistakes for a Better Life
Crypto Market Analysis: Why is it Necessary?
Cryptocurrencies such as Bitcoin, which had been ridiculed since its inception, jumped exponentially garnering mainstream relevance and worldwide adoption in the previous year. Reaching an all-time high of $69,000 on November 21, the digital asset’s valuation plummeted to less than ⅓ rd of its value in the ongoing crypto winter phase- fuelled by macroeconomic factors, geopolitical conflicts, fallouts of multiple renowned crypto projects due to discrepancies and more.
If we go by generic definitions, market research refers to an analytical process that enables data evaluation in regard to new products and their market viability through means of direct consumer research. Investment decisions can be made by checking a digital asset’s practical applicability in real-world scenarios, and another crucial aspect that is often overlooked- its demand in the markets. Demand, supply, and scarcity form the backbone of both macro and microeconomics- the valuation of digital assets such as bitcoin is practically governed by these foundational pillars.
This article will introduce people to the tools and techniques of market research analysis, rather than offering an extended deep dive into each and every technique. The aim is not to overwhelm the audience, but rather to represent research data in a meaningful way for the better development of investment strategies in the capital as well as crypto markets.
Also Read: The Top 7 Things to Keep in Mind for Crypto Investors
Market Research for Equity Stocks and Crypto
In the simplest terms, financial market research refers to the accumulation of information on capital(or crypto markets) and then figuring out how to use that information for trading purposes. The internet revolution has made it easy to gather information with thousands of blogs, articles, and YouTube, and most of them are free. Traders used to the stock markets can transfer their research skills into crypto as well. For newcomers, we can analyze and learn several things through the lens of the stock market trader. Let us move forward to the 2 main components of stock market analysis, namely:
1) Fundamental Analysis
The fundamental analysis aspect goes over key attributes and underlying characteristics of a company. We are talking about reports on earnings, profits, debt, equity, market conditions, sales, and even organizational management. Both traders and analysts utilize the process to ascertain whether the valuation of an equity stock reflects the company’s growth potential.
2) Technical Analysis
Technical analysis is what separates capital or crypto markets trading from gambling. It is crucial to do the necessary math work than relying solely on guesswork or intuition. The components of technical analysis are used by traders to examine statistical trends and forecast the direction of valuation- be it equity or crypto. The past price changes and transaction volume data can help predict the market mechanisms and what the future may likely hold.
Crypto Technical Analysis: The Basic Assumptions
3 basic assumptions are unanimously accepted by seasoned crypto traders, and they include:
a) The Market Does Eventually Discount Itself
Every variable that can potentially a crypto asset’s price is actually reflected in its valuation. Fundamental factors do not affect a digital asset’s valuation in a big way. Candlestick chart patterns are enough to decipher a crypto’s price movements.
b) Crypto Price Movements Appear in Trends
The movement of crypto asset valuations, even in volatile markets, always displays a trend. The assumption is valid even across random market timeframes. The green and red candlesticks indicate the pattern trends and directions of a crypto asset’s likely valuation. Price movements occur in trends, and the upcoming ones in the near future are also likely to follow previously established ones- sideways, upward, or downward.
c) Crypto Market Prices follow a Repetitive Cycle
The statement- ‘History Repeats Itself’- is highly valued across the crypto community. Crypto markets display repetition. Earlier patterns can help decipher future price movements in the crypto markets.
Parametric Indicators for Crypto Market Analysis
-
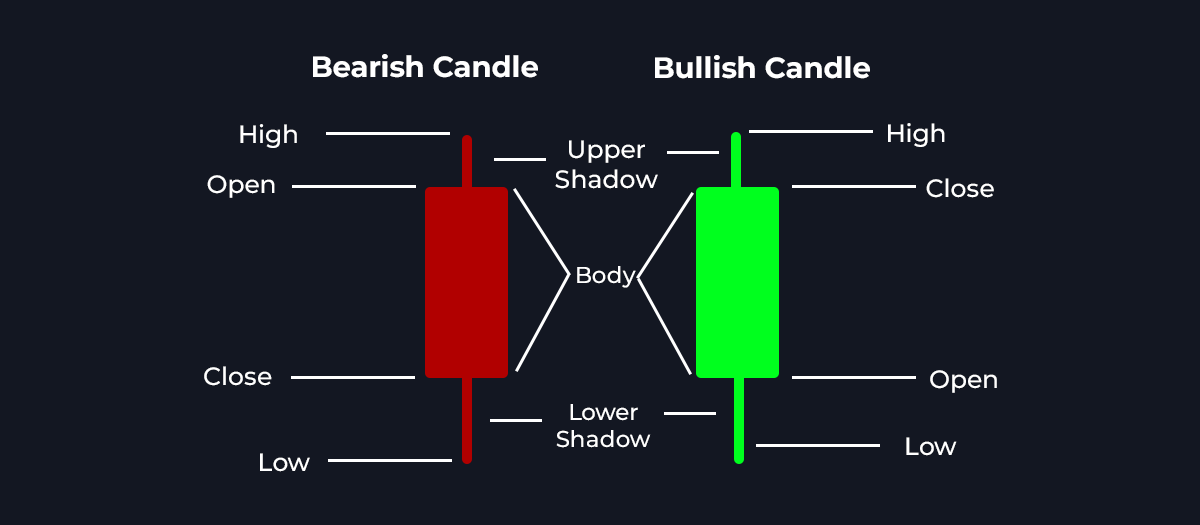
Candlestick Charts
Crypto traders prefer candlestick charts as they display price movements in a better way. A candlestick will point to crypto price movements within your desired timeframe. If you opt for a 12-hour timeframe, all the candlesticks in the graph will represent 12 hours each. Green indicates a high closing price, while red indicates the opposite. The peak and base of the wick associated with each candlestick respectively represent the highest and lowest price of the crypto asset within that timeframe.
-
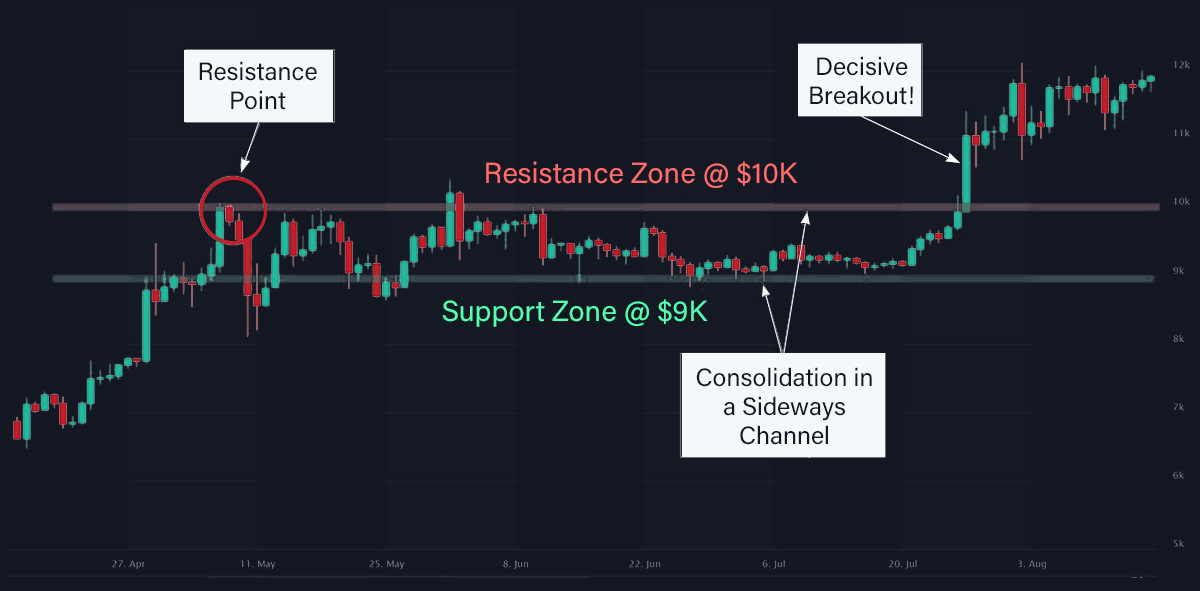
Resistance and Support Levels
Resistance refers to a price level that the crypto asset finds difficult to surpass. The support refers to the bottom price level beyond which it is difficult to descend. A good grasp of these concepts will help investors navigate through crypto markets by easily interpreting what the key chart levels signify. Therefore, the support level is the area from where the crypto asset bounces back, while the resistance acts as an upper barrier.
-
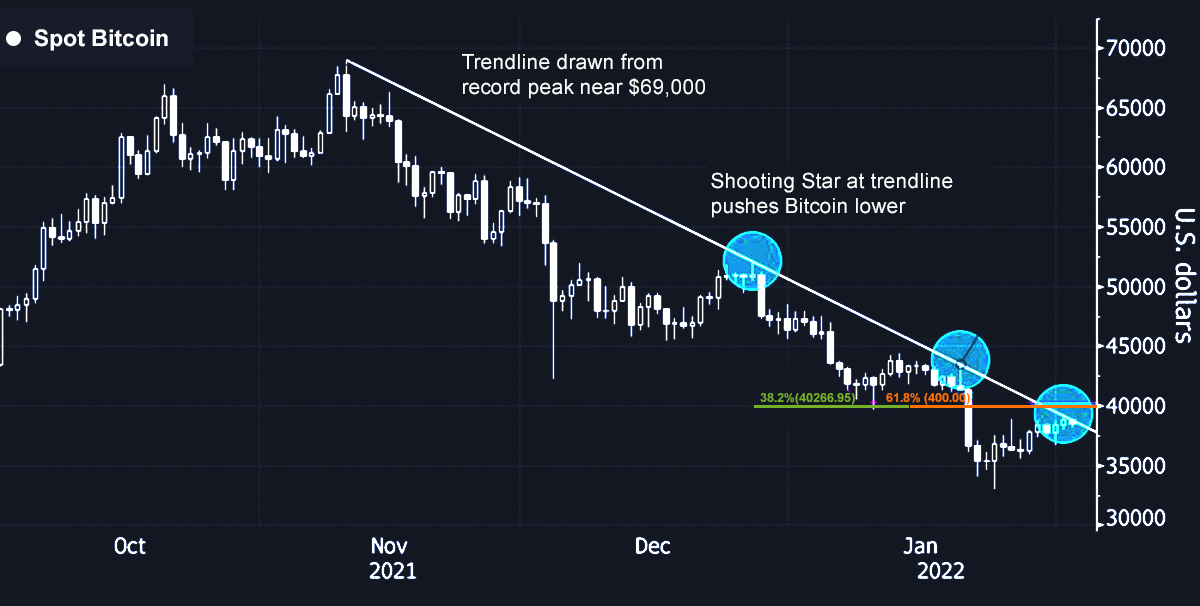
Trend Lines
Trend lines are used by crypto traders for drawing out potential and often complex market trends. Therefore, the patterns take various forms and offer a trajectory view of the asset’s likely price. Trend lines are drawn by plotting a single line connecting separate highs and lows. A greater number of connections to the line indicate greater trend strength.
-
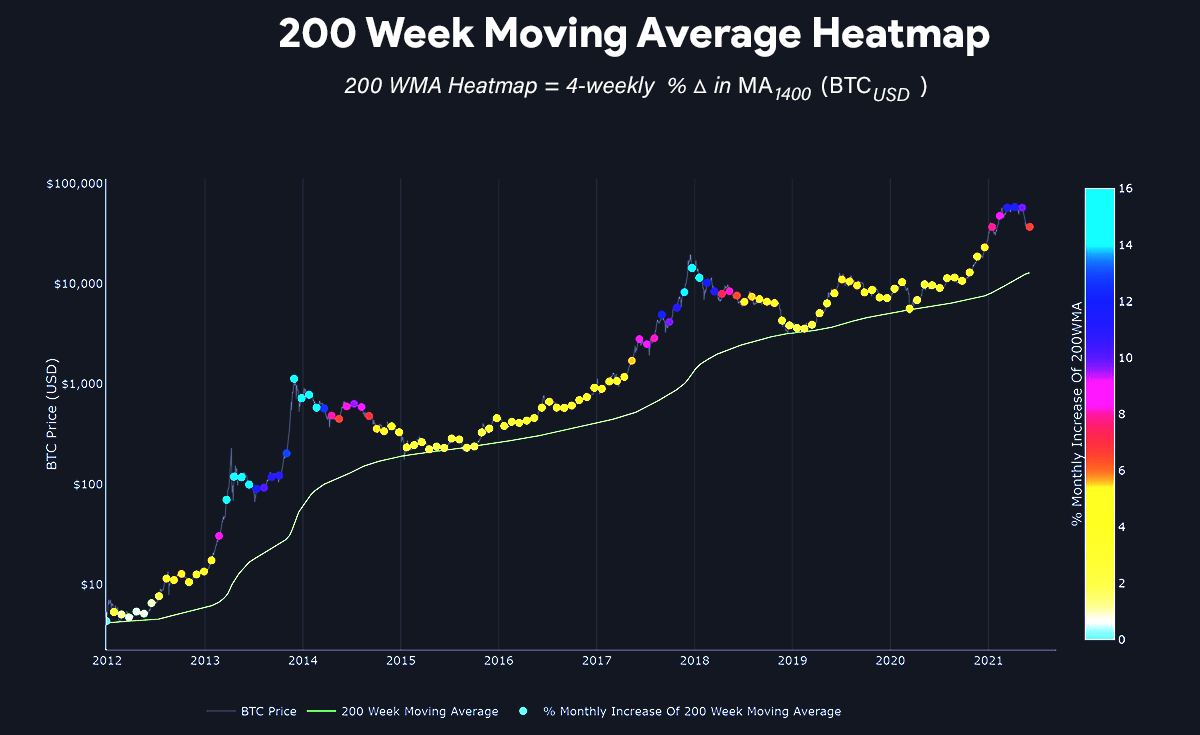
Moving Average
The moving average reflects the average valuation of a crypto’s past valuations over a specified period. One can adjust the period to the necessary timeframe for generating trustworthy indicators in a trading chart, and in real-time. Moreover, moving averages offer a good insight into the market movements and help in determining good entry price points for a trade. Moving averages are of two types: Simple Moving Averages and Exponential Moving Averages.
-
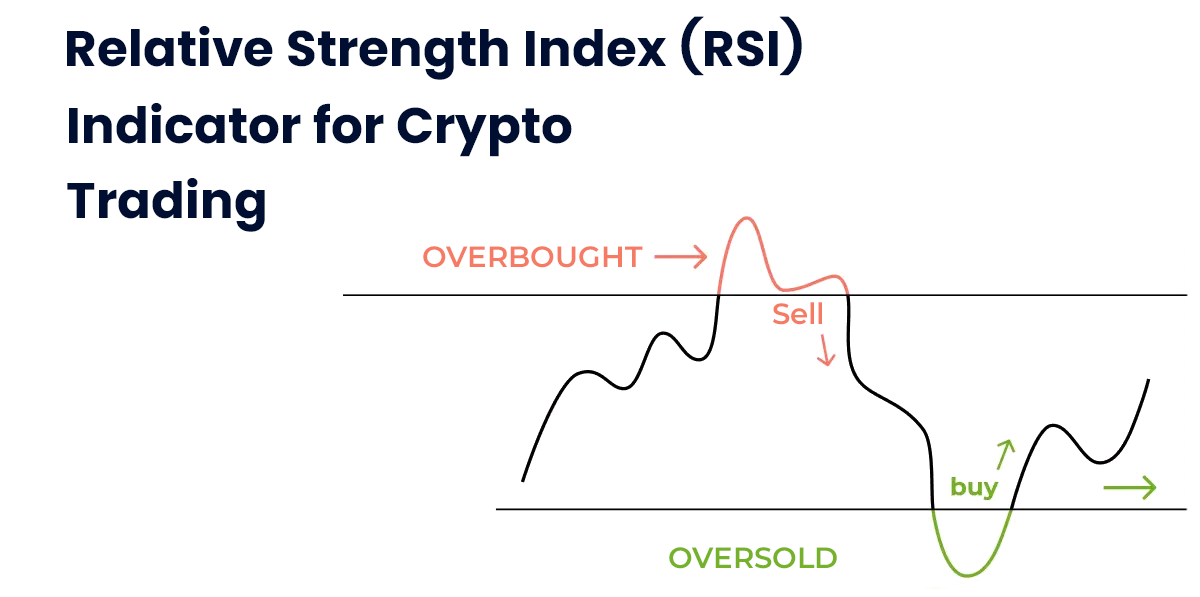
Relative Strength Index
With a range of 0 to 100, the RSI indicator is oscillatory in nature and offers insight into the transaction volume of an asset. An RSI score below 30 indicates the asset is over the cost price. An RSI score exceeding 70 reflects that a crypto asset is higher than that price level. It is better to sell at overbought levels and buy at oversold levels.
-
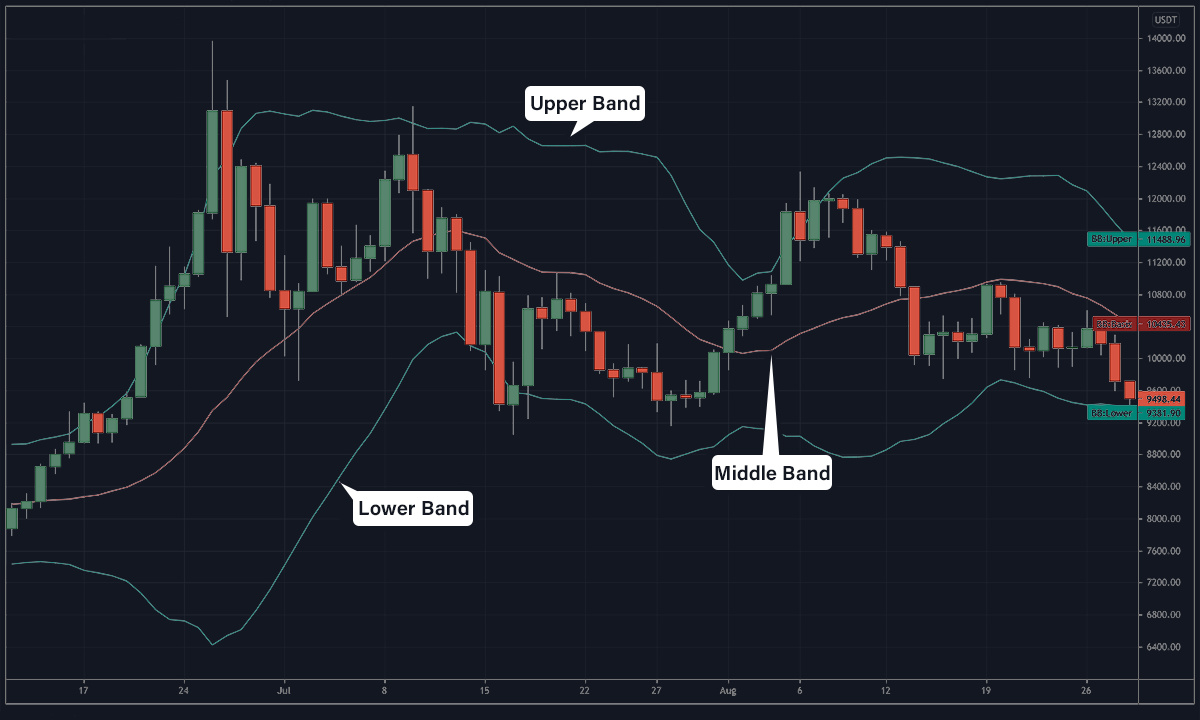
Bollinger Bands
Bollinger Bands utilize a 20-day moving average and adjustments with the standard deviation from the moving average. A crypto asset with a price over its upper Bollinger band is overbought and oversold if it remains below the lower band.
Criticisms of Technical Analysis
The history repeating itself aspect of crypto technical analysis is not without controversies, as the repetition rarely occurs in the exact same manner. Inconsistency is another major concern, and a notable number of investors believe that once read beyond existing charts/patterns and delve deep into the crypto community. It is necessary to understand how cryptos operate. Thus the fundamental analysis is also necessary, as these factors help in determining the price of an asset as well as long-term investment strategies. The rational approach is combining the two.
Techniques Used in Market Research Analysis
The above-mentioned topics are fundamental in nature and valid for all aspects of crypto trading. However, large-scale investors utilize additional approaches, often outside the realm of open trading markets. They need to know market opportunities, and thus commit heavily to analysis. Institutional investors also utilize market research analysis methods for additional business opportunities.
Market research analysis processes can be classified and further sub-divided into:
-
Statistical Analysis
A vital component of mathematics, statistics is for quantification, or providing numerical values during an analysis. Statistical analysis has further subdivisions:
a) Regression Analysis:
The regression analysis is to decode a relationship between dependent and independent variables. The variable factors(two or more) determine the valuation of equities or digital assets. The regression technique is further subdivided into:
- Linear Regression
- Multiple Regression
b) ANOVA Test:
An acronym for Analysis of Variance, the ANOVA test helps in determining the impact that independent variables have over dependent variables.
c) Conjoint Analysis:
In this process, researchers often conduct surveys and use the data obtained to determine the key determining factors. Thereafter, the process features analyzing trade-offs in decision-making to reach the most popular outcome.
d) T-Test:
T-test is for the comparison of separate data sets. Moreover, deciphering the significance of the mean value difference between two separate datasets if any.
e) Crosstab Analysis:
The quantitative analysis process is for data that are different and mutually exclusive.
-
Data Analysis
Knowledge, as they say, is power. Data analysis helps in decoding useful information from data, and the process involves inspection, cleaning, transformation, and modeling of data for effective decision-making. The techniques in the data analysis methods are under the following categories:
- Descriptive Data Analysis
- Diagnostic Data Analysis
- Predictive Data Analysis
- Prescriptive Data Analysis
Wrapping Up
Market research, as a subject, is highly expansive and elaborate. A regular trader or investor is more than likely to find the entire process too lengthy and cumbersome. However, most institutional investors conduct their own research before allocating capital to any asset or equity. Prices and valuations fluctuate but having an understanding of the market trends helps wealth creation in the long run.
Spreadsheets containing millions and billions of numerical figures overwhelm and distract the viewer from seeing the actual picture. Therefore, this is exactly why graphs and infographics are better options for decoding trends over time. Crypto online platforms like PayBitoPro provide detailed candlestick charts of price fluctuations in the volatile crypto markets, helping investors decipher trends and patterns, and leverage opportunities at the lowest transaction processing charges.

Categories
- AI (9)
- Altcoins (10)
- Banking (10)
- Bitcoin (133)
- Bitcoin ETF (11)
- Bitcoin Price (30)
- Blockchain (49)
- Brokering World Hunger Away (16)
- Business (9)
- CBDC (11)
- COVID-19 (3)
- Crypto ATMs (1)
- Crypto Banking (17)
- Crypto Bill (1)
- Crypto business owner platform (31)
- Crypto Investment (3)
- Crypto Markets (5)
- Crypto Payment (33)
- Crypto Payment Processor (2)
- Crypto Prices (1)
- Crypto Trading (92)
- Cryptocurrency (401)
- Cryptocurrency Exchange (108)
- Data Visualization (2)
- Decentralized Finance (7)
- DeFi Payment (9)
- DEX (3)
- Digital Currency (22)
- Ethereum (2)
- FAQ (6)
- Finance (24)
- Financial Equality (4)
- Financial Freedom (8)
- Forex (24)
- ICO (2)
- Investment (11)
- Mining (3)
- News (66)
- NFTs (2)
- P2P (1)
- PayBitoPro (692)
- PayBitoPro Coin Listing (6)
- PayBitoPro Exchange (2)
- Post COVID Digital Transformation (1)
- Press Release (130)
- Privacy & Security (3)
- Real Estate (1)
- Stablecoin (4)
- Technology (14)
- Uncategorized (3)
- US Presidential Election (2)
- Utility Coin (1)
- Web3 business (3)
- Web3 Wallets (2)
- White Label Crypto Exchange (7)
Recent Posts
- Top White Label Crypto Exchange Platforms for Businesses in 2026
- Top Crypto Payment Gateways in 2026
- Payment Challenges for Offshore Brokers — And How to Solve Them
- Why Forex Brokers Are Switching to Crypto Payment Processors in 2026
- Crypto Payment Processor for High-Risk Merchants: A Complete Guide to Secure, Fast & Reliable Payments